Record cold and snow in Brazil

All you've done is parroted conservative talking points.

Ha!

It would be miserable, since humans have a hard time living in those CO2 concentrations.
Indeed. Drowsiness sets in at about 1000ppm and headaches and other health effects at about 5,000ppm, I think.

But a lot of the major cities of the world, and low-lying countries such as the Netherlands and Bangladesh, will be under water by then.
 
The trick is in studying the knowledge base within one specialty, then stepping back to gain a broader perspective, then diving into the knowledge base of a proximal specialty, then stepping back........etc...
Which nobody who finds people like Schmelzer "informative" has done.
the southern ocean had been cooling from 1990 to 2010(reversed now)
? Still getting your info from Schmelzer's sources?

Sounds like a Schmelzerfact, right up there with the greening of the planet under the global warming regime that does not exist, the dominant political pressure from the left on climate research funding, the nuclear bomb solution to excessive heat in Asia Minor, the Chinese farmers switching from wheat to trees when it gets too hot in the southern Chinese "ovens", the identification of landscape climate tipping points with ecotones on mountainsides in the Alps, the "common sense" claim that the number and importance of beneficial organisms which will enjoy advantages from the AGW that does not exist is comparable to those of harmful organisms, and so forth.

I bit - a three minute keyword netting of actual research turned up nothing but this kind of report: https://www.wilsoncenter.org/sites/...ocuments/PolarPerspectives-Report-FINAL_0.pdf
The rate of global ocean warming and, thus, heat uptake has more than doubled since 1993, attributed to greenhouse gases and ozone depletion.[7,66–69] The Southern Ocean has warmed both on the surface and in the deep ocean, with regional and decadal variability, largely influenced by air-sea flux, wind-forced changes, and overturning circulation.[70,71] From the surface to 2000 m, the Southern Ocean increased its share of heat uptake up to 45%-62% in 2005-2017,[7] and the deep Southern Ocean below 2000 m has stored a large fraction - up to one third - of the total anthropogenic heat excess since 1992.[72,73] These Southern Ocean warming trends, documented over the last century, are projected to continue, leading to 1°C–3°C warming by 2100
 
Which nobody who finds people like Schmelzer "informative" has done.
I found Schmelzer's Syrian posts most informative and detailed compared with anything else posted.
http://www.sciforums.com/threads/war-between-us-and-iran-iraq-syria-lebanon.162729/
the southern ocean had been cooling from 1990 to 2010(reversed now)

? Still getting your info from Schmelzer's sources?
In the mid 1990's Australia converted to a digital temperature measurement system that averaged one second digital measurements over each minute with the highest minute average being the maximum temperature for the location for the day per World Meteorological Organisation (WMO) and International Civil Aviation Organisation (ICAO) standards. Sometime in the mid 2010's this was changed so that the digital second temperatures are no longer averaged and the highest second measurement in a minute is used to calculate the maximum temperature for the day.

I don't doubt that climate change is driven by human activities and I can certainly agree that 'the science is proven' with regards to higher temperatures being recorded in Australia compared with identical past digital readings.

Coming from a technical QA background I think that science shouldn't stoop to political methods.
 
LaurieAG:

It sounds a bit like you're trying to say that the temperature measurements have been rigged to make them look higher, even though there's no real increase in the average temperature.

Is that what you meant to say, or did I misunderstand?
 
LaurieAG:

It sounds a bit like you're trying to say that the temperature measurements have been rigged to make them look higher, even though there's no real increase in the average temperature.

Is that what you meant to say, or did I misunderstand?

That's a very poor straw man James R.

Around 10 years ago I worked for a government organization and was held responsible as business owner of the organizations Human Resource Information System's data and databases for over 3,500 employees. I lost count of the number of times I had to identify where seemingly innocuous system changes requested by bureaucrats would corrupt the data I was held responsible for so please don't question my professionalism and allude to conspiracies.

You may just as well say that the billions of dollars of expenses resulting from poor software system specifications/implementations in Queensland were an ongoing conspiracy as there is very little difference between the end results of direct corruption and bureaucratic/political incompetence.

What I am saying is that if you think that the ends justify the means and have such a strong belief in the ends that you are prepared to accept modifications to those means without qualm if they lead to further justification of your beliefs, please don't mistake this for science as it only muddies the waters and makes the real science more difficult.

https://jennifermarohasy.com/wp-content/uploads/2014/05/Marohasy-to-Finkel-20180504.pdf

In my work for the government organization I also worked very closely with internal and external auditors so it must be noted that many of the details provided in the 3 bottom links are actual comparison audits between the raw and ACORN data sets that are not related to the BOM's ACORN peer reviewed technical report for the data normalization process used.

http://www.bom.gov.au/climate/data/acorn-sat/

https://www.semanticscholar.org/pap...rker/416535e78f10fb968bf5134d437ee2cc3d2b86e5
http://www.waclimate.net/
http://www.waclimate.net/bureau.html
 
I found Schmelzer's Syrian posts most informative and detailed compared with anything else posted.
So did I. Especially the maps, and the propaganda analysis - he follows propaganda very closely, and he knew enough about Syria to analyze it from a basis in reality.

His extension of what he knew about Syria to US politics was largely bullshit, of course (iirc at one point he was blaming the entire Syrian war on Hillary Clinton), but if we exclude his apparent part time role as Russian troll farm parrot that was apparently because he didn't know anything about them - he was either unable or unmotivated to correct the misapprehensions of his reliance on propaganda from a basis in physical reality. Sculptor found him "informative".

This is apparently a thread on climate change, or Brazilian weather, or something like that (Sculptor deals in innuendo, not argument from evidence). Something to do with AGW, anyway. Schmelzer knew almost nothing about the physical realities of AGW, was (according to himself) strongly motivated by a desire to prevent international organization and coordinated governmental response to anything, and was thereby led into some truly bizarre nonsense by the propaganda he relied upon for his information on AGW. Sculptor found him "informative".
What I am saying is that if you think that the ends justify the means and have such a strong belief in the ends that you are prepared to accept modifications to those means without qualm if they lead to further justification of your beliefs, please don't mistake this for science as it only muddies the waters and makes the real science more difficult.
As far as I can tell from your spaghetti post there, you are in fact - as James speculated - claiming a political motive (something to do with "beliefs") for what appears to you is rigging or manipulation by the official Australian agencies in charge of recording meteorological and climatological data.
I lost count of the number of times I had to identify where seemingly innocuous system changes requested by bureaucrats would corrupt the data I was held responsible for so please don't question my professionalism and allude to conspiracies.
The links you provided also allude to conspiracies, as does your wording in response to James ("accept modifications - - justification of your beliefs"). You should provide at least a hint of support for your apparent assumptions about other people's beliefs, when basing accusations on them.
This, for example, is from one of your links:
For the best quality climate change analysis blog in the world, check Watts Up With That?
Now I know almost nothing about Australian climate change politics and related research, but I do keep a weather eye on the site "Watt's up with that", and it is a conspiracy-supporting site with a well established rightwing corporate political agenda. (If you prefer to make your own judgment, find an archive of past blog entries on that site, long enough back that events have caught up with claims, and draw your own conclusions. Their long running attempt to sell the "pause", for example, including misrepresenting satellite data calibrations as nefarious schemes to hide global cooling, was unethical at minimum). I would need some persuading to trust anyone who would recommend that site without warning the naive reader, much less describe it in such glowing terms.
That's a very poor straw man James R.
So correct him, and me: What are you trying to argue?

You are not posting clearly - for example:
A straight reading of your post and links indicates that you object to the Australian government's clumsy undermining of the IPCC by corrupting the data it provides, or at least appearing to.
I doubt that. But I would prefer better correction than my doubts.
 
Iceaura, I made no reference to "Watt's Up with That?"
As I posted and quoted: your link recommended it. Your other links also feature some similar warning flags - I quoted just the one as an example, an illustration, chosen because I am familiar with it and don't have to do any work.
The links you provided also allude to conspiracies, - - -
- - -
This, for example, is from one of your links
I am one of those people who actually read links and such when forming opinions about them and what they are supposed to support, you see.
I use such references - things I can check for myself - to evaluate the reliability of stuff I cannot easily check. In this case, your linked sources - your sources you chose to post for support for what you claim are professional and expert opinions - feature some very dubious recommendations,
that being a prime example.

This is the particular link of yours that I quoted:
If you were unaware that this source of yours was praising dubious and unreliable blogs, recommending politically erratic and agenda driven pretenders to scientific care and reason to others, you have my sympathies - we all get fooled once in a while.
But that is no reason for this:
QUOTE="LaurieAG, post: 3682084, member: 194784"]Obviously you also consider the following as a conspiracy.[/QUOTE]
? No, I don't. As I posted, right there in post 66 for you to read, I have little familiarity with Australian politics - even in matters of climate change, let alone payroll statistics and other matters I have paid little attention to in any context outside of the US. I could well be persuaded, by evidence and argument, that there was some kind of political bias or agenda corrupting the collection and analysis of meteorological data in Australia (there is in the US, for example - a couple of rightwing corporations with solid Republican Party backing were and possibly still are trying to privatize and gain monopoly control of government obtained taxpayer funded meteorological data, and part of their strategy has been to corrupt and slander NASA and NOAA and similar government sources of weather reporting)

Mistakenly assigning opinions and stances and so forth to people I can verify have not posted any such things (such as myself) is yet another reason to doubt someone's judgment in matters I cannot easily check. Your using such mistakenly assigned stances to attempt personal slander and attack on this forum is reason to doubt not only your judgment but your motives as well.

But you can restore civility fairly easily, by responding straightforwardly to other people's posts:
So correct him, and me: What are you trying to argue?
 
Iceaura, I am not going to respond to your conspiracy theme and your borderline ad homs any further. Just like your responses in the Syrian thread they are political methods and not science.

The following article, that was published today by Australia's national broadcaster, illustrates the type of things I have been talking about. FYI, yesterday was Tuesday August 24, today is Wednesday August 25 and Sydney's coldest maximum daily temperature since 1984 was recorded officially on Monday August 23.

https://www.abc.net.au/news/2021-08-25/bom-says-weather-bomb-unlilkely-to-go-off/100403638
The cold southerly winds led Sydney to a maximum of 10.2 degrees Celsius yesterday, the coldest maximum daily temperature since 1984.
However, the temperature rose to 11.5C at 9am today, which becomes Sydney's official daily maximum temperature for Tuesday.
 
FYI, yesterday was Tuesday August 24, today is Wednesday August 25 and Sydney's coldest maximum daily temperature since 1984 was recorded officially on Monday August 23.

Correction: I was thinking about minimums not maximums so Sydney's coldest maximum daily temperature since 1984, the 10.2 degrees Celsius that occurred yesterday, was NOT recorded officially on Monday August 23 as it was warmer than that on Monday.
 
Iceaura, I am not going to respond to your conspiracy theme and your borderline ad homs any further. Just like your responses in the Syrian thread they are political methods and not science.
"Political methods"? "Conspiracy theme"? "Ad homs"?

Uh, maybe try addressing the content of my posts, rather than what you appear to see as their form or hidden motives? Just a suggestion.

I never argue ad hominem, "borderline" or otherwise. It's largely a propaganda tactic, and I'm not a propagandist (although if you were to offer career advantages and cash on the barrelhead in amounts similar to what the "Watt's Up - - " guys have been blessed with - - - - ). So that you can safely drop from consideration.
(specifically: An argument ad hominem is first an argument; the fad of shortening the term to "ad hom" and applying the consequently obscured term to any and all disparagements or criticisms or even pejorative labels began and largely continues as a propaganda tactic of the American rightwing corporate shill. The immediate symptom of trouble is its use as a plural - that almost never makes sense.

Rhetorical tip: Notice that "ad homs" role in those other bad American people's corporate shilling is exactly to evade argument, to replace the difficulty of arguing from evidence with innuendo, cheap and reflexive slander, etc. In consequence, that particular illiteracy has become a characteristic feature of the rightwing lunatic fringe in the US. It's well known, familiar, an everyday encounter. When addressing a liberally educated American from the position of a STEM educated professional the entire term is best avoided.
The following article, that was published today by Australia's national broadcaster, illustrates the type of things I have been talking about.
But you haven't been talking about them. You haven't, for example, explained the relevance of this particular problem - which appears to be an issue of news media sensationalism in Australia, a matter of misleading casual TV watchers about a matter of little scientific importance, a propaganda issue ("conspiracy theme") of the exact kind you explicitly (and inaccurately) disparage in other posters right here - to the thread.

Meanwhile: You have posted a solid page or two of "conspiracy" claims regarding climate change in this thread alone. Your links relevant to climate change are almost entirely devoted to them. And that is not, in itself, wrong or bad. Entirely real and disappointingly common "conspiracies" do exist - some even leading to outright fraud in scientific matters. They need to be recognized and argued, though - your posts and links here, to the extent they address the thread topic at all (rather than bureaucratically bollixed HR statistics) deal mostly in slander and innuendo, and far too often in the very slanders and innuendos familiar to Americans from the past three or four decades of - - do I have to repeat it again?

So we have this on the table:
A straight reading of your post and links indicates that you object to the Australian government's clumsy undermining of the IPCC by corrupting the data it provides, or at least appearing to.
I do not see how the issue you raised has much significance regarding the IPCC, or to the thread matter (the presence or absence of snow in Brazil does not appear to be a matter of instrument calibration, and pending informed warning the "record cold" seems unrelated to recent changes in Brazilian meteorological gear or techniques)
So correct him, and me: What are you trying to argue?
 
Last edited:
The difference between 10.3 and 11.5 degrees Centigrade is 1.2 degrees and it indicates a bias against lower maximums that don't actually reflect the temperatures recorded during the actual day in Sydney and other places with similar circumstances in Australia. The weather man on Al Jazeera said today that the 11.5 degree temperature recorded in Sydney was the second lowest maximum in a quarter century which is less significant than the coldest maximum since 1984 as reported by our ABC.

Incidentally, I was looking for rainfall results in Greenland due to reports of record rainfall there recently and could not find any actual records apart from one site where the details for the 3 days this month were blanked out. I noticed that they also reported their temperatures and rainfall to 9:00am their time so I assume the bias against lower maximums referred to above is common around the world in similar circumstances.

The reason I was looking for the actual rainfalls is because the articles describing this event only talk about 7 billion tonnes of rain in 3 days. So I decided to calculate the average rainfall in millimeters per square meter.
http://www.bom.gov.au/climate/data-services/content/faqs-elements.html
For every square meter of horizontal surface area, 1 millimeter of rainfall will produce 1 liter of water.

3 day rainfall = 7,000,000,000 tonnes with 1,000 kilograms per tonne

As the Greenland ice sheet size is slightly larger than Greenland itself I used that.

Area of rainfall = 1,710,000 square kilometers with 1,000,000 square meters per square kilometer

As 1 kilogram is the weight of 1 liter of water and 1 liter of water is equivalent to 1 mm of rainfall for a square meter the calculation is simple.

7,000,000,000 x 1000/1,710,000 x 1,000,000 = 4.094 kilograms/meter ( liters/meter) or 4.094 mm of rainfall in 3 days averaged for every meter of the Greenland ice sheet.

I understand the point being made in the articles although Crawford Point had 14mm in 2.5 days (below) so the rainfall must have varied quite a bit over the entire ice sheet if the average was 4.094 mm.

http://nsidc.org/greenland-today/2021/08/rain-at-the-summit-of-greenland/
GT_SummitRainAugust2021_Fig5-copy.png
 
Incidentally, I was looking for rainfall results in Greenland due to reports of record rainfall there recently and could not find any actual records apart from one site where the details for the 3 days this month were blanked out. I noticed that they also reported their temperatures and rainfall to 9:00am their time so I assume the bias against lower maximums referred to above is common around the world in similar circumstances.
There are very few, if any, places "around the world" in similar circumstances. The closest might be remote mountain glaciers or outlying stations in Antarctica.

The records for rainfall on much of the area involved will not exist, because it has never rained there in modern times. Apparently some weather stations at or near the "summit", which is where the rain was most startling and newsworthy, did not have rainfall gauges or other suitable equipment for measuring liquid precipitation. They certainly have no "biases" in their reporting of maximum rainfall amounts - they have never had to do that before now.

This was not a matter of bias or the like - transporting and maintaining gear used in those stations is expensive, and they keep unnecessary equipment to a minimum. The rain was a remarkable and completely unexpected event.
I understand the point being made in the articles although Crawford Point had 14mm in 2.5 days (below) so the rainfall must have varied quite a bit over the entire ice sheet if the average was 4.094 mm.
The Greenland ice sheet is larger than most European countries, and varies in height by many hundreds of meters - the assumption that rainfall amounts will vary considerably over that expanse is a safe one.
 
You have all these misconceptions because you are fundamentally ignorant of the history of this. From the beginning this field of study has been referred to as "anthropogenic global warming" which means man made changes that cause warming. The planet is warming overall; that is well proven. It will not warm everywhere at the same rate. Some places will be _cooler_ due to AGW. One example of this is rainfall - a warmer climate evaporates more water, which causes larger rainstorms, which causes transiently lower temperatures in the areas affected.

People shorten that to "global warming" or "climate change" sometimes. Up to them, not you.

The terminology is really pretty simple to understand, unless you have a political agenda that requires you to not understand it.
After reading the many grandiloquent posts from the climate experts in this thread, what percentage is natural climate change and thus, what percentage is climate change due to man's activities?
 
After reading the many grandiloquent posts from the climate experts in this thread, what percentage is natural climate change and thus, what percentage is climate change due to man's activities?
Per AR4, approximately 93%. This will continue to increase as a percentage as we add more and more CO2. See diagram below for the various forcings and how significant they are.

image_large
 
Per AR4, approximately 93%. This will continue to increase as a percentage as we add more and more CO2. See diagram below for the various forcings and how significant they are.

image_large
Interesting because co2 has little effect on the climate, 95% of the greenhouse effect is water vapour and water vapour is not changing.
 
Interesting because co2 has little effect on the climate, 95% of the greenhouse effect is water vapour and water vapour is not changing.
Exactly.

If CO2 were our primary greenhouse gas, we would be dead already - because our temperatures would have gone up so high that much of the earth would be uninhabitable (and the rest not very amenable to growing crops.) We are fortunate for two reasons.

One, water vapor is our primary greenhouse gas - and we're not messing with that too much.
Two, the CO2 absorption band is almost (but not quite) saturated. Which means that increasing the concentration by 50% does not increase heat retained by 50%, but by only a few percent.

These two reasons are why we are seeing only a 1C increase even though we have increased CO2 by 50%.

As it stands now, each square meter on earth receives 1000 watts/sq m in direct sun. If you average over morning, evening and night, that comes to about 340 watts per square meter. We have increased that by about 2 watts due to the forcings in the table above - which is why we are seeing this warming.
Have a read

https://www.cnsnews.com/news/articl...ho-got-it-right-predicts-20-more-years-global

Probably one of the tiny few scientists that got it right
 
Probably one of the tiny few scientists that got it right

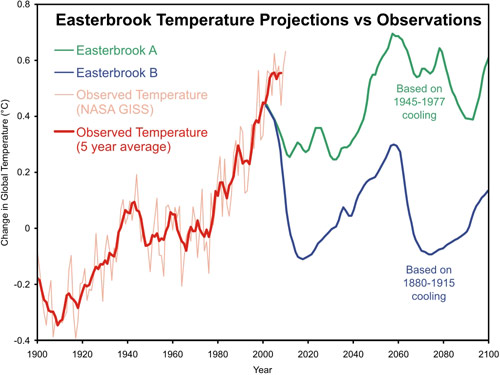
From the article: "Dr. Don Easterbrook – a climate scientist and glacier expert from Washington State who correctly predicted back in 2000 that the Earth was entering a cooling phase – says to expect colder temperatures for at least the next two decades."

Here are Easterbrook's predictions compared to reality:
Easterbrook_Projection_500.jpg


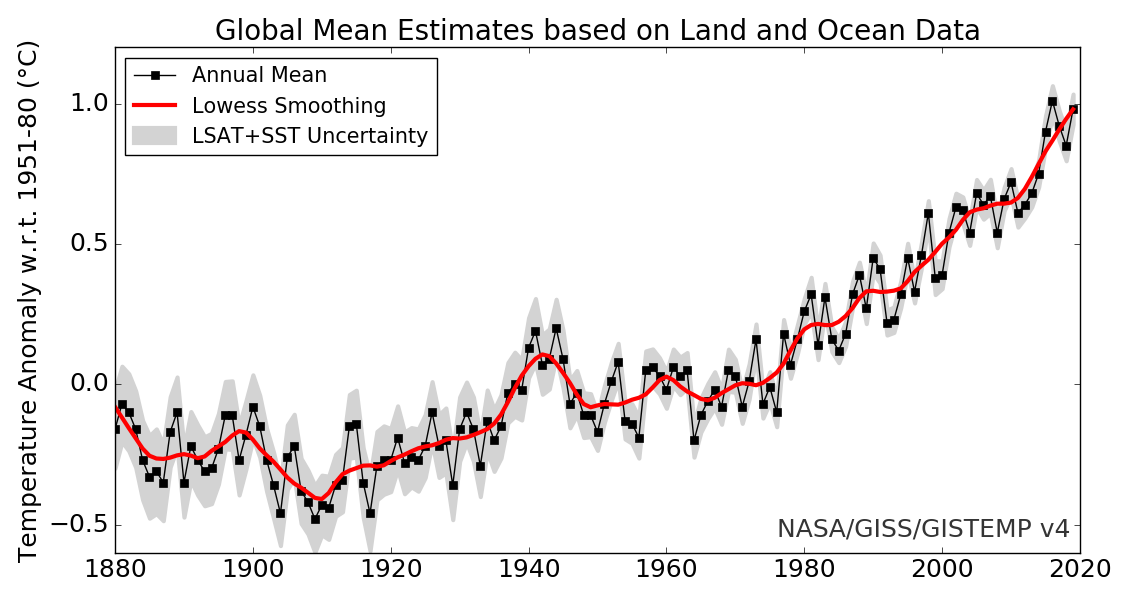
And here's the temperature record through 2020:

phpJS2jMK


Maybe you could point to where Easterbrook's cooling is.
 
Interesting because co2 has little effect on the climate, 95% of the greenhouse effect is water vapour and water vapour is not changing.
Water vapor is changing as AGW intensifies - consistently warmer air carries more water vapor than cooler air, and boosted CO2 heat trapping leads to consistently warmer air. That's one of the many positive feedbacks driving AGW.

CO2 is the dominant and most effective greenhouse gas, the one that keeps the Earth warm enough to support liquid water on its surface, drives AGW, and causes climate change, because it stays in the air longer than the others. Significant amounts of boosted CO2 remain in the atmosphere, trapping heat, for centuries. Water vapor alone, without CO2 warming to keep it suspended, will (by physics, reasonably well confirmed by the geological record) condense and precipitate out of the atmosphere of the Earth in a fairly short time under ordinary temperature variation in time and geographical circumstance (evaporated water from the northern Pacific ocean often rains out on coastal mountains within a few hours, for example) - and once gone into ice or aquifer storage nothing will bring it back except some other source of heat. This has happened in the geological past, apparently, during times of reduced CO2 levels, with consequences scientists have labeled "Snowball Earth". http://snowballearth.org

After reading the many grandiloquent posts from the climate experts in this thread, what percentage is natural climate change and thus, what percentage is climate change due to man's activities?
As you have been informed several times here, with links and all that:
All of the warming is probably due to man's activities - we are probably coming out of an interglacial, and "naturally", by the Milankovitch cycles and other (even smaller) forcings, we should be cooling on average. Slowly, of course - nothing "natural" matches the rate of AGW except very large meteor strikes.
 
Last edited:
Back
Top